The first step in addressing climate change impacts or climate-related extreme weather events is to understand the vulnerability of different areas. For this, it is essential to map areas for vulnerability. This information also helps in planning adaptation and mitigation strategies and climate-related plans. India has had a district-level mapping since 2021. The question is how has it been used – or not – by various district and city-level agencies to understand and address climate challenges.
The Council on Energy, Environment and Water’s (CEEW) report Mapping India’s Climate Vulnerability: A District Level Assessment,[1] by Abinash Mohanty and Shreya Wadhawan, provided a comprehensive district-wise analysis of the climate vulnerability in India and offered a climate vulnerability index (CVI) that mapped exposure, sensitivity, and adaptive capacity using spatio-temporal information.
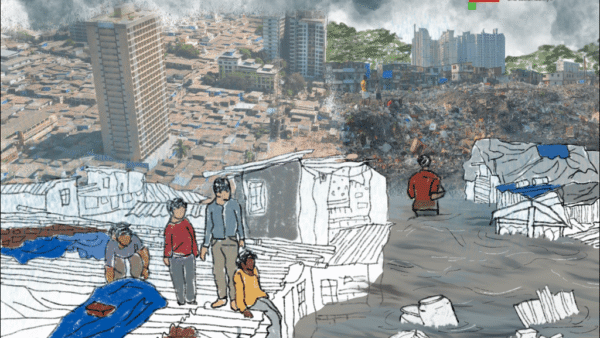
India’s northern and eastern states, such as Bihar and Assam, showed disproportionate vulnerability and vulnerabilities varied significantly even within a district emphasising the need for localised interventions. Also, it highlighted how more than 40 percent of districts in India are witnessing a ‘swapping trend’,[2] which means flood-prone districts are facing droughts and traditionally drought-prone areas are now facing more frequent floods. More than 80 percent of India’s population lives in districts which are “highly vulnerable to extreme hydromet disasters”.
The report identified districts disproportionately affected by climate change that led to potential economic losses exceeding Rs 6.76 trillion (USD 89.7 billion) over the past two decades. It analysed drought, flooding, cyclonic events and their compounded effects in various zones (northern, southern, eastern, western, north-eastern and central) of the country, and outlined direct and indirect impacts of climate risks on agriculture, water resources, health, and infrastructure.
Photo: Wikimedia Commons
The assessment took into account various socio-economic and environmental parameters like exposure to climate hazards (the nature and degree to which a system is exposed), sensitivity of communities (the degree to which a system is affected) and adaptive capacities (the ability of a system to adjust to climate change), thus forming a multi-dimensional approach to vulnerability mapping. The CVI integrated spatial, temporal, and location-specific indicators.
The sensitivity analysis shows a surge in extreme climate conditions in the country post-2005 largely due to landscape disruptions. In an increasingly volatile climate landscape, hyper-local strategies can help reduce impacts and minimise or avert loss and damage. The CEEW report, with recommendations, can help authorities to map, plan and strategise against climate extremes. The researchers suggested an improvement in disaster preparedness, investment in sustainable infrastructure, and effective policy frameworks that prioritise climate adaptation and mitigation.
They urge “developing a high-resolution Climate Risk Atlas (CRA) to map critical vulnerabilities at the district level, establish a centralised climate-risk commission… undertake climate-sensitivity-led landscape restoration, integrate climate risk profiling with infrastructure planning to increase adaptive capacity, provide for climate risk-interlinked adaptation financing”. In this interview, Shreya Wadhawan, researcher, Program Associate and consultant with the Risks and Adaptation team at CEEW, explains the mapping and the importance of localised vulnerability assessments.

It seems that India’s vulnerability to climate events has increased since the report was published. Has vulnerability mapping become more important
Vulnerability mapping is crucial in India where the frequency and intensity of extreme climate events are on the rise. Our report[3] highlights how such assessments provide a snapshot of current vulnerabilities, enabling policymakers to prioritise regions and sectors at high risk. By identifying the “here and now”, these maps serve as a foundation for planning — be it strengthening adaptive capacity, allocating resources effectively, or integrating climate considerations into development policies. They also help track progress over time, ensuring that interventions are targeted and impactful.
In a constantly changing climate scenario, how must we approach vulnerability mapping?
Mapping must be dynamic and iterative to keep pace with India’s evolving climate scenario. This means integrating the latest climate projections, socio-economic data, and on-ground developments into assessments. A multi-dimensional approach is key—combining exposure, sensitivity, and adaptive capacity indicators. Moreover, incorporating localised data and involving communities in the mapping process can ensure that the results are context-specific and actionable. Regular updates to the maps and alignment with technological advancements such as GIS and AI can enhance precision and relevance, enabling better decision-making.
Can you tell us about the Climate Vulnerability Index (CVI) and micro-level vulnerability mapping?
The Climate Vulnerability Index (CVI)[4] is a composite measure that captures the vulnerability of districts by assessing three key dimensions: exposure to climate risks, sensitivity of communities or ecosystems to these risks, and their adaptive capacity. By integrating multiple indicators, it provides a holistic view of how different regions fare in terms of climate vulnerability.
Micro-level vulnerability mapping, on the other hand, focuses on granular and localised assessments — district, village or block levels. It highlights intra-district disparities that may be overlooked in broader assessments. This level of detail is crucial for tailoring interventions, ensuring resources reach the most vulnerable populations, and enabling local governments to design effective, context-specific adaptation strategies. Both approaches complement each other in building resilience from the ground up.
Is it necessary to have a micro-level approach to changing vulnerability patterns?
Absolutely. While a holistic approach provides a broader understanding of regional vulnerabilities, a micro-level methodological approach is indispensable for capturing localised nuances, especially as vulnerability patterns evolve. Micro-level mapping identifies specific at-risk communities, ecosystems, and infrastructure within broader vulnerable regions. It accounts for variations in socio-economic conditions, local adaptive capacities, and exposure to risks, which may not be apparent in district-level assessments.
For instance, CEEW’s study on Climate Risk Assessment for Critical Infrastructure and Healthcare Resilience[4] highlights the importance of granular assessments to safeguard vital healthcare infrastructure and services in specific regions. Similarly, the report Decoding Changing Monsoon Rainfall Patterns Due to Climate Change in India[6] demonstrates how micro-level insights into rainfall variations can guide localised adaptation strategies for agriculture and water management. This dual approach ensures that policies and interventions are comprehensive and targeted, addressing systemic challenges while tailoring solutions to local realities.
What were the key findings in terms of regions, gender and class? How does the report approach inequity in climate vulnerability?
As our research primarily focused on regional disparities in vulnerability, we did not explicitly study gender and class. However, the findings did highlight significant regional inequities. For example, northern and eastern states like Bihar and Assam are disproportionately affected by extreme weather events, such as floods, which compound existing socio-economic vulnerabilities. In terms of addressing inequities, the report stresses the importance of localised vulnerability assessments to capture nuances in exposure, sensitivity and adaptive capacity. Focusing on district-level data inherently considers the vulnerabilities faced by marginalised communities within those areas.
While gender and class were not central to the analysis, future studies could build on our findings by integrating these dimensions. Addressing these inequities would involve targeted interventions and inclusive measures that recognise the specific challenges faced by women, low-income groups, and marginalised communities. A study by the M.S. Swaminathan Research Foundation (MSSRF), Safeguarding Women & Children from the Impact of Climate Change,[7] built on our report to understand the multiple impacts of climate change on women and children across India’s 20 agro-ecological zones.
Photo: Wikimedia Commons
Which of the report’s findings remain most relevant?
Several findings remain highly relevant. First, the disproportionate vulnerability of India’s northern and eastern states, such as Bihar and Assam, due to frequent floods and low adaptive capacities. Second, the need for localised interventions remains crucial as vulnerabilities vary significantly even within districts. The report highlights how more than 40 percent of districts in India are witnessing a ‘swapping trend’,[8] which means flood-prone districts are facing droughts and traditionally drought-prone areas are now facing more frequent floods. This shows the dynamic nature of climate risks and the need for flexible, region-specific adaptation strategies.
These findings are further validated by our recent reports such as Decoding Changing Monsoon Rainfall Patterns Due to Climate Change in India[9] which finds that 64 percent of India’s tehsils experienced an increase in the frequency of heavy rainfall days during the southwest monsoon in the past decade. This is prominent in tehsils of states with the highest Gross Domestic Product (GDP) – Maharashtra, Tamil Nadu, Gujarat, and Karnataka.
Additionally, the identification of the critical role of adaptive capacity in infrastructure, governance, and socio-economic resilience continues to resonate in today’s climate discourse. Finally, its call for integrating vulnerability assessments into development planning remains important.
What changes have you seen to climate adaptation since the report was published?
India has made significant strides in climate change adaptation. Initiatives such as the National Action Plan on Climate Change (NAPCC) and state action plans have evolved to incorporate localised and sector-specific strategies. There’s a stronger focus on nature-based solutions,[10] as seen in programmes like the Amrit Darohar[11] and MISHTI[12], which encourage the optimal use of wetlands, building livelihoods of local communities, and preserving such ecosystems.
India has also advanced in integrating climate resilience into urban planning. There’s also a growing emphasis on using technology such as early warning systems[13] and climate modelling to improve preparedness. However, scaling these efforts equitably and aligning them with long-term sustainability goals remain critical challenges.
One of your recommendations is to develop a Climate Risk Atlas. Can you elaborate how this can help?
A Climate Risk Atlas is a powerful tool for a country like India which shows vast climate diversity. It can provide a clear visual representation of vulnerabilities across different geographies to floods, droughts, heat, and cyclones. The Atlas would allow policymakers to tailor adaptation strategies for specific regions so that interventions are relevant and effective. For instance, coastal areas might prioritise cyclone preparedness while drought-prone regions could focus on water conservation and agriculture resilience.
The Atlas can facilitate cross-sectoral planning guiding efforts in agriculture, infrastructure, and public health based on local risks. Updating it regularly with new climate data would make it a dynamic tool, allowing for real-time adjustments in planning and resource allocation. This would be especially crucial as climate patterns shift and new risks emerge.

Photo: Wikimedia Commons
How can cities use CVI in their planning?
Cities can use the Climate Vulnerability Index (CVI) to integrate climate risks into urban planning by identifying vulnerable neighbourhoods and sectors. The CVI helps prioritise areas with high exposure to climate hazards such as flooding, while also considering the socio-economic capacity of these areas to adapt. By embedding CVI into planning processes, cities can ensure that their development projects and policies are aligned with the most pressing climate risks, making them more resilient and adaptive.
Further, climate mapping is a crucial tool to build resilience. It allows for the visualisation of localised vulnerabilities, helping urban planners design targeted interventions such as improved drainage systems in flood-prone areas or cooling centres in heat-affected zones.
Mapping also facilitates the integration of nature-based solutions, like green infrastructure, which can reduce urban heat and manage stormwater. For example, CEEW’s work in preparing Thane’s flood[14] and heat action plans[15] utilised climate mapping to assess vulnerability. The mapping identified critical areas at risk of flooding and extreme heat, allowing for the design of targeted mitigation measures such as flood protection infrastructure and heat action plans. This approach ensured that Thane’s resilience efforts were data-driven and specific to the city’s challenges.
How can vulnerability mapping be used to make a difference to people on the ground?
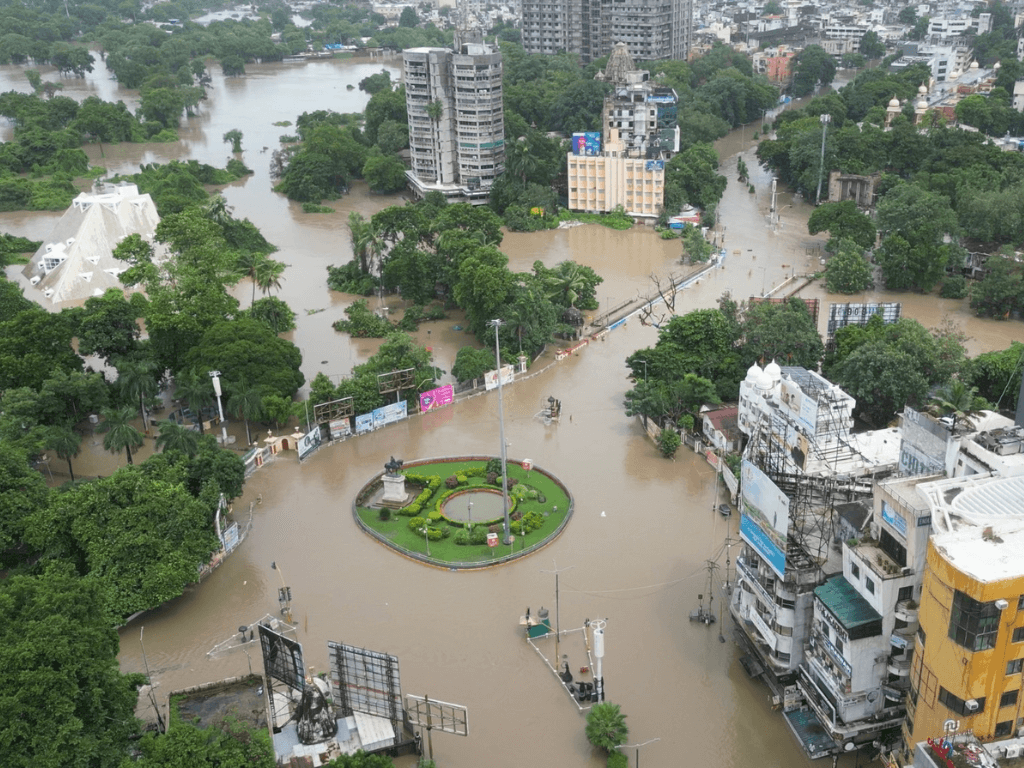
Vulnerability mapping plays a crucial role in translating climate data into actionable interventions which directly benefit people on the ground. By identifying regions, communities, and sectors most at risk, these maps enable governments and organisations to prioritise resources and actions where they are needed the most. For instance, in flood-prone areas, mapping can guide the construction of flood defences or the relocation of vulnerable communities, ensuring that no one is left behind in adaptation efforts.
On a more localised level, vulnerability mapping helps design targeted programmes such as early warning systems, heat action plans, and climate-resilient infrastructure. In areas identified as high-risk, local governments can deploy tailored interventions like strengthening healthcare systems, improving water access, or providing climate insurance to farmers. Mapping also facilitates community engagement by identifying specific vulnerabilities and involving locals in adaptation strategies. This ensures that interventions are not only data-driven but also community-centric, enhancing their effectiveness and long-term sustainability. Vulnerability mapping directly and indirectly improves the lives of those most affected by climate risks.
Nikeita Saraf, a Thane-based architect, illustrator and urban practitioner, works with Question of Cities. Through her academic years at School of Environment and Architecture, she tried to explore, in various forms, the web of relationships which create space and form the essence of storytelling. Her interests in storytelling and narrative mapping stem from how people map their worlds and she explores this through her everyday practice of illustrating and archiving.
Cover photo: Mandar Gandevikar