Weeks before the Spring Equinox on March 21 and festivities to mark the change of season from winter to spring, it felt like summer had already set in across India. Day temperatures in major cities soared well above normal for this time of the year and nights were not much cooler.
Mumbai recorded a high of 39.4 and 39.3 degrees Celsius on March 13 and March 6 respectively, six degrees above normal. Safdarjung in New Delhi showed 34.1 degrees Celsius, five degrees above normal while the mercury at Najafgarh, Ridge, Pitampura and Sports Complex in Akshardham breached 35 degrees Celsius on March 13. Punjab, Uttar Pradesh, and Madhya Pradesh saw temperatures this February that were more common in mid-March in previous years.
India has early summers, summer-level temperatures earlier in the calendar, and higher maximum temperatures through the summer season, based on what the last few years show. As it did last year, this March too, the Indian Meteorological Department (IMD) sent out warnings of heat waves till May, especially in northern, central and western regions of the country.
The IMD, typically, declares a heat wave when temperature reaches 4.5 degrees Celsius above normal for an area or a city, and raises it to an intense heat wave when temperature exceeds 6.4 degrees Celsius above normal. A heat wave is also declared if the highest temperature exceeds 40 degrees Celsius in the plains, 30 degrees Celsius in hilly areas, and 37 degrees Celsius in coastal zones.
With record-breaking heat levels, the role of Heat Action Plans (HAPs) to secure lives and livelihoods becomes significant. India’s first HAP was by the Odisha government back in 1999 after the state registered more than 2,000 deaths the previous summer; it was revised several times, last in 2020. The first city-based HAP was prepared by the Ahmedabad Municipal Corporation in 2013 after the spate of heat-related deaths in May 2010 which claimed 1,344 lives in a week.
Heat waves, as studies have proven, cause a range of health impacts like heat stroke, heat stress and even death. The National Disaster Management Authority (NDMA) estimated that between 1992 and 2015, heat waves had caused 24,223 deaths in India. It issued guidelines in 2016 to combat heat waves, and updated them three years later. As many as 130 cities and districts across 23 heat wave prone states are now preparing HAPs, some of which are being drawn up with granular level data such as ward-wise vulnerable areas or heat hotspots.
There cannot be one-size fits all HAP given the variations in climatic conditions, geographical locations, population density and so on, but plans show common features. Early warning systems with colour-coded alerts (yellow for heat, orange for severe heat, and red for extreme heat), public awareness campaigns, capacity building of healthcare systems, and implementing adaptive measures such as cool roofs and increasing green cover are common to all HAPs. What they lack is the long-term framework which addresses core issues such as land zoning, building codes and materials, transport and energy use which contribute to high heat and the Urban Heat Island phenomenon.
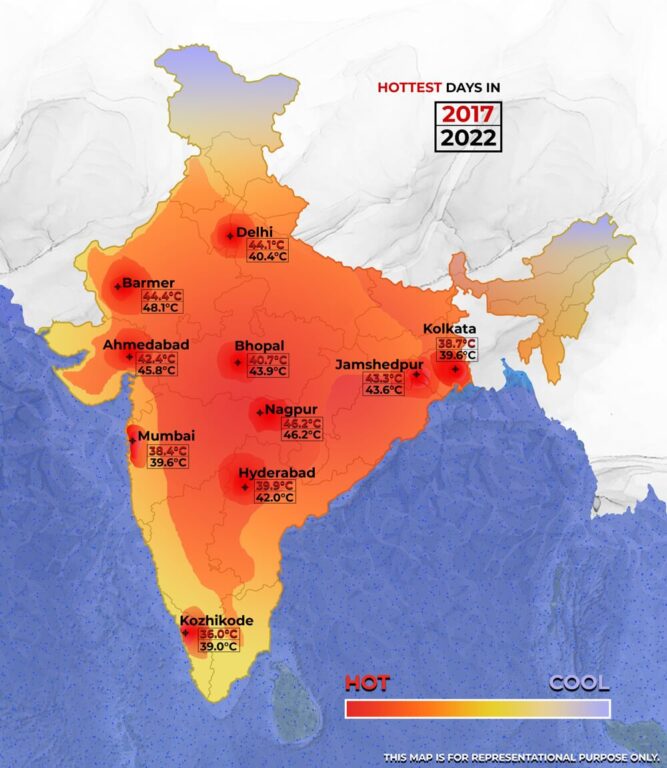
The need for comprehensive HAPs with short-medium-long term measures, has been felt deeply as heat maps become worse with every passing year. Cities across India have seen a rise in their high temperatures over the years. The cities chosen for this map show an increase in their maximum temperatures over the years. A handful of cities show slightly lower temperatures now than they did earlier, but these may well be the outliers.
Last March was the hottest across northern, western and central India in 122 years with maximum temperatures even in hill stations such as Dehradun and Dharamsala touching 34-35 degrees Celsius. Coastal cities like Mumbai and Chennai regularly touch their highest maximum readings. From Banda in Uttar Pradesh which recorded 47.4 degrees Celsius to Chandrapur in Maharashtra and Delhi which breached 46 degrees Celsius, large metropolitan cities and Tier II cities sizzled.
The average maximum temperatures in Delhi through March-April last year were nearly five degrees above normal. When Delhi registered a staggering 49 degrees Celsius in mid-May, bringing the world’s attention to the national capital, it was the city’s fifth heat wave last year in about two months.
While heat waves are not uncommon in India, the trend of the last few years has been high maximum temperatures and more days of high temperatures through summer. However, people often feel hotter than the recorded temperature. This apparent or “felt” temperature is the heat index, a complex coefficient which factors in relative humidity with the air temperature. Earlier this March, while cities in Kerala sizzled in mid-40s, the heat index showed as high as 54 degrees Celsius. A city’s temperature now needs to be measured and communicated as heat index value too: what it is and what it feels like.
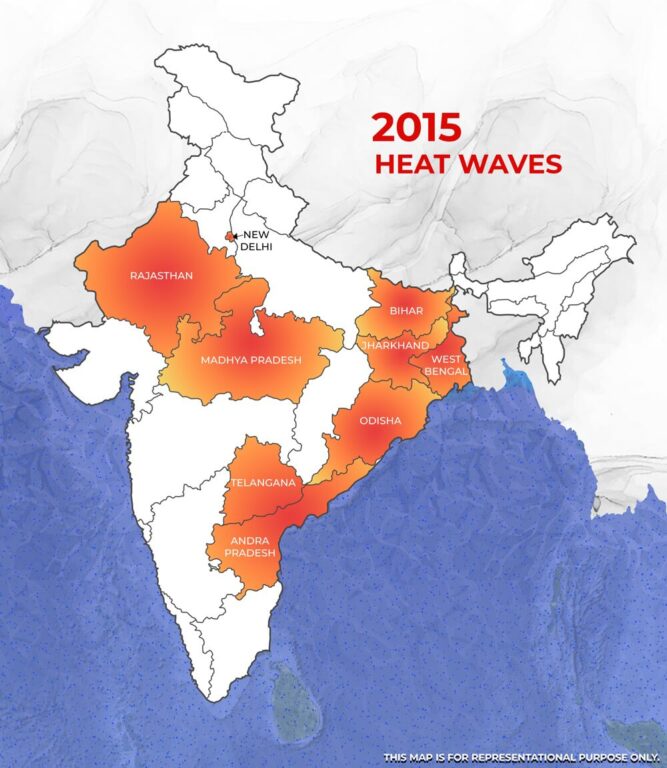
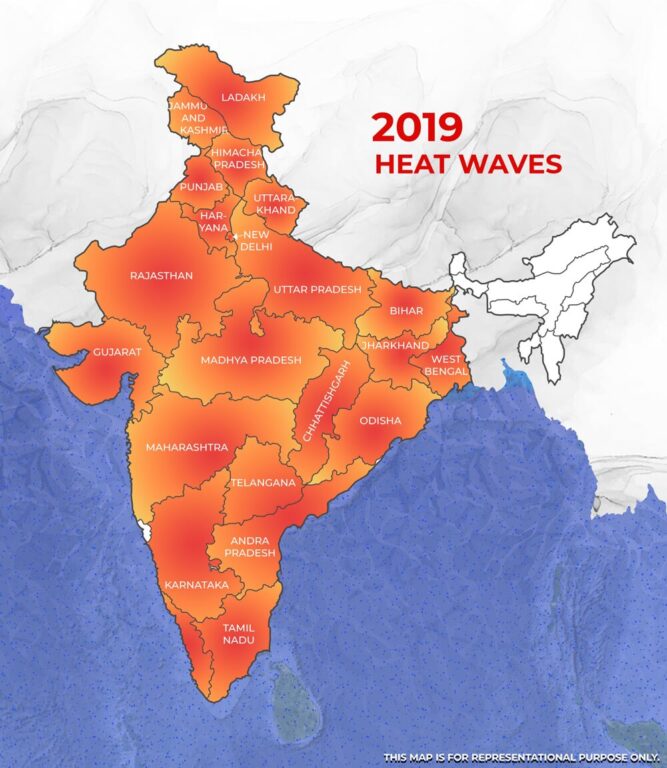
The heat spread across India is visible in the number of states affected in the vulnerability maps. From nine states in 2015 that were heat-affected, the number rose to 23 in 2019. Additionally, the number of heat wave days in a year have increased, according to the IMD data for the Forecast Demonstration Project. From an average of 7.4 days in 2015 – roughly a week in the entire summer – the heat wave days increased to an average of 32.2 in 2019 which is more than a month of summer.
The heat wave incidence has been rising since 2005-06 across India. The summer of 2017 saw the fourth consecutive heat wave in the country. In the four years between 2014 and 2017, heat waves are estimated to have taken at least 4,500 lives, according to NDMA data. “The baseline death rate due to heat induced climate change in the early 2000s in India was 550 per 100,000 population. India is projected to see 10 percent increase in death rates,” noted the Climate Impact Lab in 2019.
The Intergovernmental Panel on Climate Change (IPCC), in its Fifth Assessment Report, showed that the last 50 years saw an increase in the frequency of hot days and heat waves globally. “Between 1979 and 2017, the frequency of instances of wet-bulb temperatures at or above 27 degrees Celsius has more than doubled and instances over 29 degrees Celsius more than tripled. South Asia is a hotspot for heat waves and related incidences…the extreme combinations of heat and humidity doubled in much of India, Bangladesh, and Pakistan,” observed a detailed analysis of India’s HAPs in 2021.[1]
The report underscored the need for comprehensive HAPs and, after analysing plans of cities and states across India and South Asia, suggested that the plans and climate action goals in states should be synchronised well. It recommended “the development of a database to identify vulnerable areas, (and) specially designed measures to implement heat adaptive measures.” It also flagged off the increased demand for water and electricity during a heat wave, citing research which showed an increase of 30 percent in Delhi’s power demand during the high temperatures.
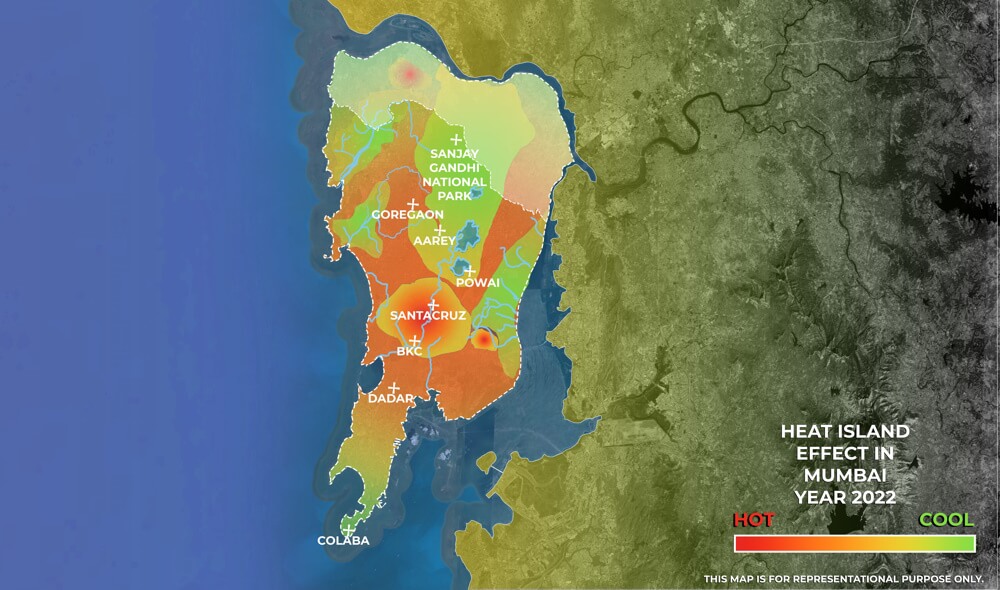
Like all large metropolitan cities, Mumbai too shows the Urban Heat Island (UHI) phenomenon which is when the temperature of a densely-populated and densely-built city is at least two degrees higher than its suburbs or surrounding rural areas. A detailed analysis of temperatures in more than 40 India cities across all seasons from 2001 to 2017, by Indian Institute of Technology (IIT) Kharagpur, found evidence of “mean daytime temperature of surface going up to two degrees for most cities”.
The UHI is the outcome of several factors including the loss of vegetation cover in cities, lack of open spaces, construction material such as concrete and asphalt which have high heat capacity and thermal conductivity, and so on. Semi-urban or rural areas outside the city tend to have more green cover and open space, and use ‘cooler’ materials.
Mumbai’s maximum temperatures of 39.4 and 39.3 degrees Celsius on March 13 and March 6 respectively, were not only six degrees above the city’s normal for the month but also significantly higher than its surrounding regions. The average temperature in February hovered around 34.7 degrees Celsius, three degrees above normal, making it the warmest February since records began to be maintained 121 years ago. In 2022, the highest was 40 degrees Celsius on March 28.
Even within the city, the areas of Mumbai surrounding its green belts of Aarey forest and the Sanjay Gandhi National Park feel cooler than the commercial and concretised areas such as Bandra-Kurla Complex characterised by their glass facade buildings which are known to trap heat. Additionally, the areas close to the sea with abundant mangroves are cooler too. Plants and trees store water in their roots, stems and leaves, which is released as vapour and acts as a natural coolant when the mercury rises. Buildings, sidewalks, car parks, and streets are built with concrete, asphalt, brick, glass and steel which retain heat and keep the land hot even at night.
A multi-researcher study published in the peer-reviewed Springer Nature journal in 2020[2] showed that Mumbai lost 81 percent of its open land, 40 percent of its green cover, and approximately 30 percent of its water bodies between 1991 and 2018 when the built-up area across the city increased by 66 percent. says a recent study. Other studies have corroborated this. Among the outcomes is the two to three-fold rise in temperatures and micro-climates in areas within the city.
On March 13, various areas of New Delhi, from Safdarjung to Najafgarh and Pitampura to Akshardham registered 34 to 35 degrees Celsius, which was five degrees above normal. This February saw Delhi’s hottest day in the month since 1969 when the mercury touched 34 degrees Celsius, a temperature that is more common in March in the city especially in the latter half of the month.
Last year, Delhi had recorded its maximum of 39.6 degrees Celsius on March 31; in 2021, it was 40.1 degrees Celsius on March 30. However, its surrounding areas were cooler. When NASA took an image of the Urban Heat Islands in and around Delhi on May 4 last year, it found that the night-time temperatures in Delhi and several smaller villages were above 35 degrees Celsius and peaked at 39 degrees Celsius. The rural fields, however, had cooled to around 15 degrees Celsius.[3]
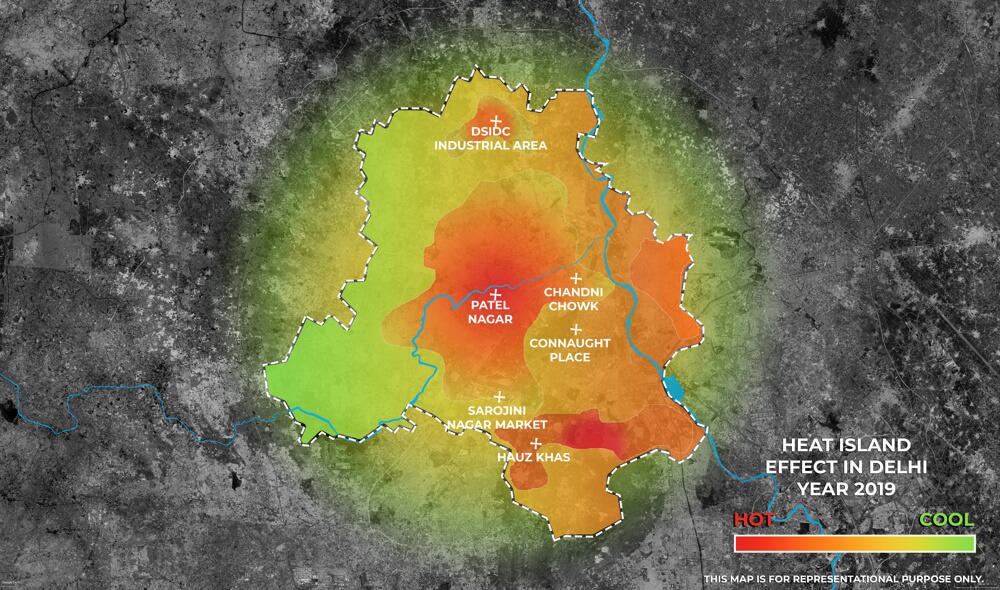
“The central and eastern districts of Delhi had the highest land surface temperature because they mainly consist of residential areas and networks of paved roads. Some parts of northwest Delhi had lower temperatures due to the presence of wasteland and fallow land…Residential areas, industrial zones and commercial hubs exhibited the highest temperatures which implies that urban development does increase the land surface temperatures,” observed a study published ten years ago in The Nature.[4]
A study done in 2008 found that Delhi’s top-ranking Urban Heat Islands were in commercial locations, namely Connaught Place, Sitaram Bazaar and Bhikaji Cama Palace, as well as in mixed-use areas such as Noida, Dwarka, Janakpuri, Kaushambi and Adarsh Nagar. The study also showed that green and forest vegetation have a greater impact on lowering the effects of UHIs as compared to water bodies like rivers.[5]
While Delhi’s overall forest cover showed a marginal increase in the last few years, the Very Dense Forests and Moderately Dense Forests categories saw a decline.
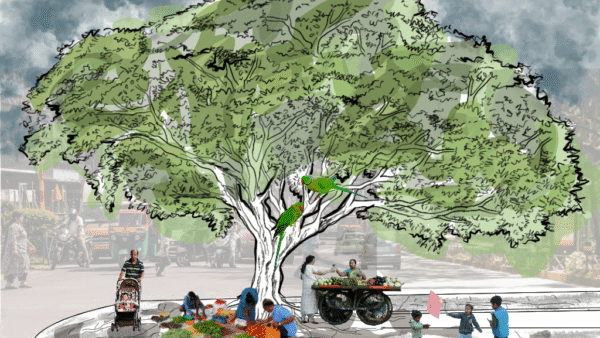
To combat heat waves, there is no option but to build with nature and conserve what’s left of it in cities. The greener – and bluer – a city, the cooler it can be.
Sources:
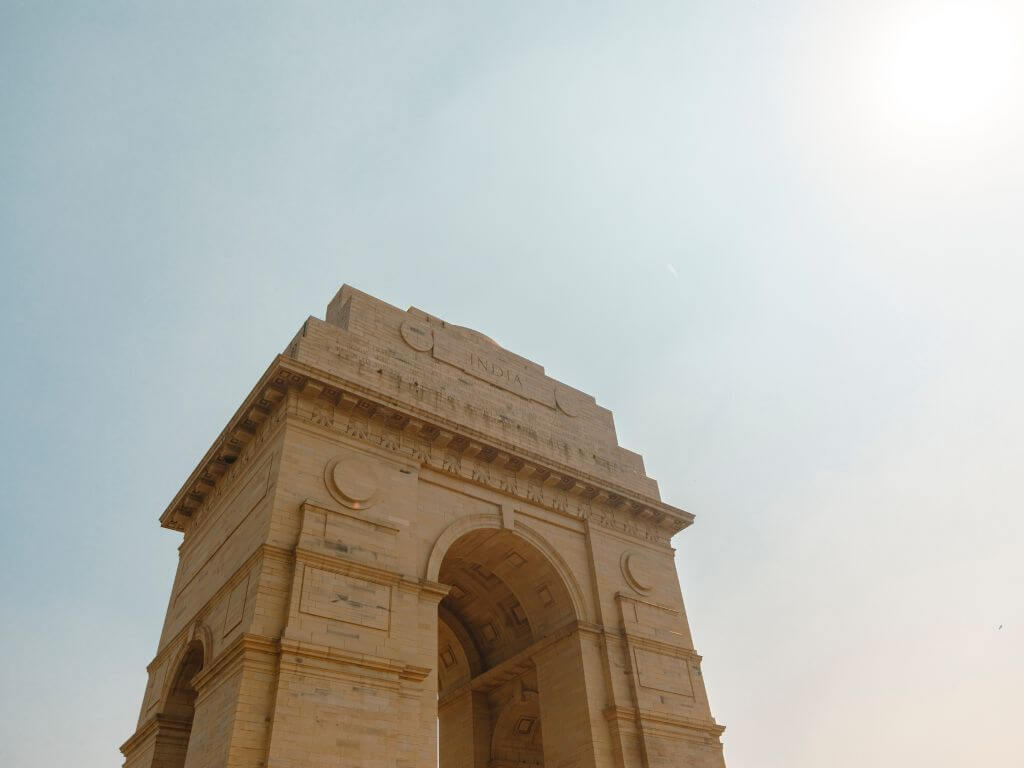
Cover photo: Daniel Dara/ Unsplash